Putting Science Fairs to the Test

"Participation in science fairs offer students a real pathway into science careers," says EDC's Abigail Jurist Levy.
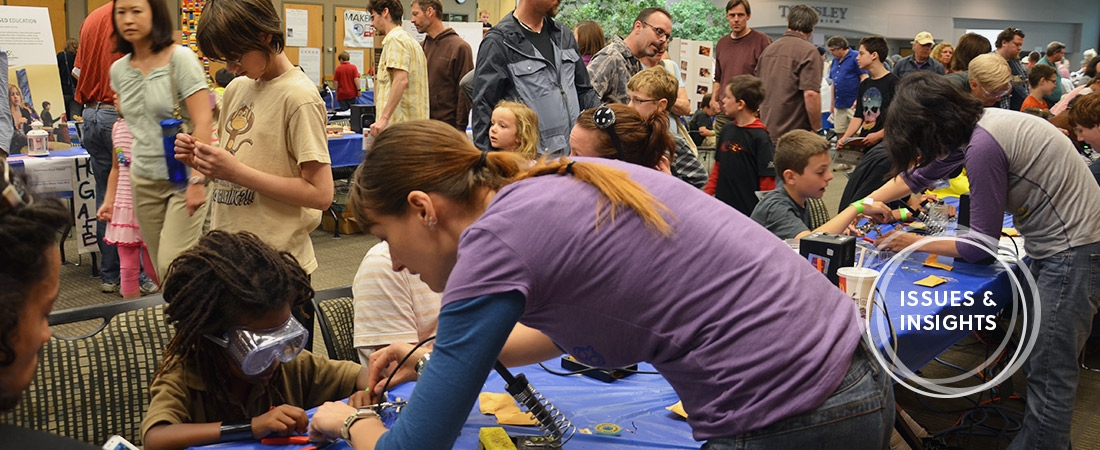
This year, thousands of middle school students will participate in science fairs across the United States. These events will inspire some students to embark on a career in STEM; they may also launch others into fame.
Yet despite their popularity, little research has been done about science fairs. Is there a best way to hold a science fair? What makes for an effective one? And how can teachers ensure that all students have an equal chance to participate?
With funding from the National Science Foundation, EDC’s Abigail Jurist Levy, Jackie DeLisi, and Marian Pasquale decided to put science fairs themselves under the microscope. Here, they discuss what they have learned so far.
Q: How did you become interested in middle school science fairs?
Levy: The role of science and engineering practices, such as asking questions, defining problems, using data, and carrying out investigations, has been elevated in new science frameworks and standards. But teachers can have a hard time providing opportunities for students to exercise those practices in class. The science fair is a perfect setup for students to experience the entire investigative process, so we wanted to learn more about how science fairs are aligned with these new standards, and how they might be used to promote inquiry-based experiences in the classroom.
Q: You examined middle school science fairs across the United States. What have you learned so far?
DeLisi: Our biggest finding is that there’s no typical science fair experience. In some, students set up their posters in a gymnasium or cafeteria, and judges grade each presentation. That’s sort of a standard model. But we also visited schools where students presented their projects in science class, and then the teacher picked a few students to move on to the whole school science fair. This gives the teacher and students a chance to ask the presenter some questions, similar to what you would see at an actual science conference.
We also found variability in the competitiveness aspect of these fairs. At some schools, the goal of the science fair was to select a handful of students to compete in prestigious district- and state-level science fairs. At other schools, the emphasis was more on participation than competition.
Q: What role do science fairs play in promoting science learning and teaching?
DeLisi: Science fairs provide students with an opportunity to investigate interesting questions, work independently, and engage in what we think of as authentic science experiences. These experiences are critical for engaging students in STEM and potentially inspiring them to pursue STEM careers down the road.
Levy: Participation in state and national science fairs offer students a real pathway into science careers. For example, I visited a high school in the Midwest where participation in the science fair was a rich tradition, on par with being part of the school’s football team. This school had a track record of success. It had students who participated in state, national, and international fairs, and who came away with prize money that helped with college tuition. Parents viewed success at the science fair as a real avenue for their kids’ futures.
Q: One critique of science fairs is that students who have the means and support to produce fantastic projects have an advantage over students who do not. How did different schools address this issue of equity?
Levy: We learned that many schools are trying to address differences in the resources and connections that students have. At one school in rural Vermont, teachers integrated the students’ science fair work into their social studies, English language arts, and mathematics classes. So for a period of time, the kids’ science investigations were the focus of all of their classwork across all disciplines. They wove the science investigation into everything else. It was outstanding.
And this was all purposefully done in school so that students would have equal access to materials and adult help. They wanted every student to have the same level of opportunity. One administrator told me that they needed to make this level of support available to each of the students as a matter of equity.
Q: What advice do you have for teachers about how to run a great science fair?
DeLisi: Successful science fairs need a committed leader who helps teachers find time for students to prepare for the fair, either in class or after school. This leader also coordinates resources, including space for the fair and basic materials that students might need.
But how you design a science fair really depends on what you want the goals of the fair to be. Is the focus on equity of opportunity? Is it on competition? Or is it on providing students with a window into actual challenges that scientists and engineers face? We saw a lot of models that worked. Ultimately, there isn’t one format that works best—but teachers’ and administrators’ decisions about what they want to accomplish are critical.
Levy: At the student level, it’s all about finding that interesting research question. For some students that comes easily, but many others need help making the connection between something they find interesting and a good, researchable question. One teacher in our study made it a point to spend time with every student in his class, helping them find a question they wanted to answer. As a result of his efforts, even the most reluctant students in his class began their science fair experiences with questions that they were really curious about. And once their curiosity was piqued, they were ready to undertake authentic science investigations.
